Carbon accounting in Spain, from company total to every product.

Measure Scope 1, 2 and 3 emissions in Spain with the product, supplier and primary facility data fashion and retail teams need to make the numbers useful.

Spain flagSpainBook demo now
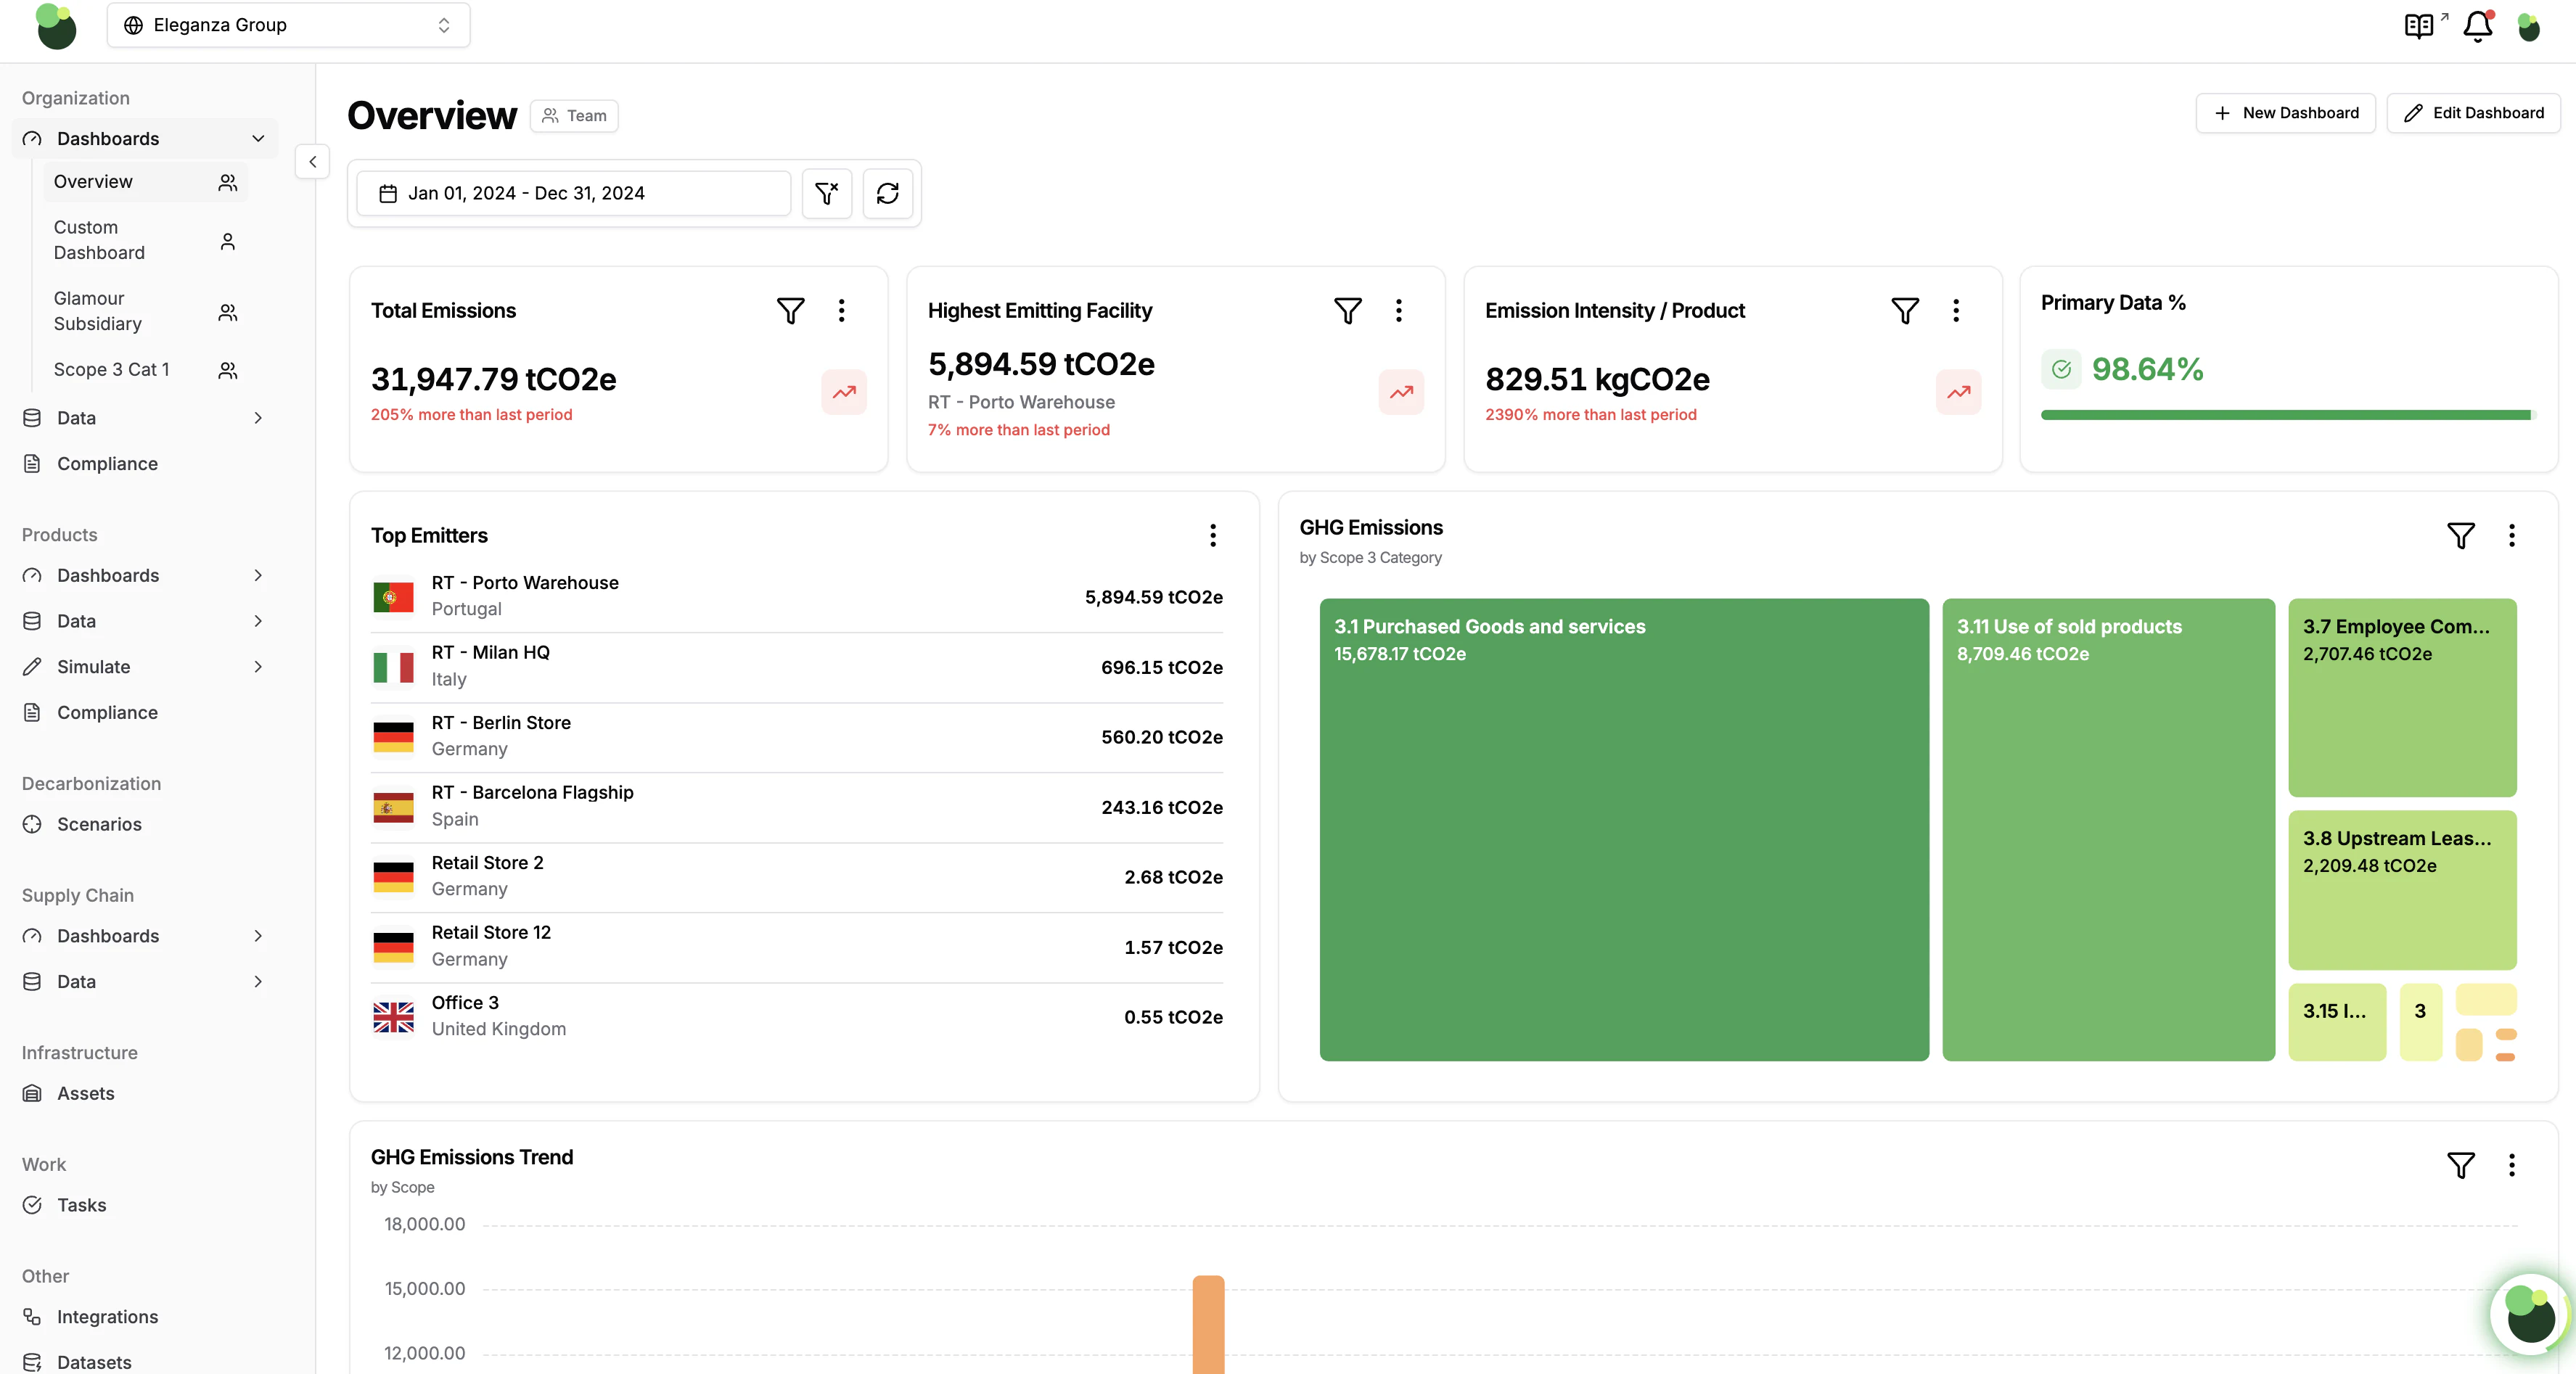
Carbon Trail corporate carbon accounting dashboard showing emissions totals, primary-data coverage, top emitters, Scope 3 categories and emissions trends

GHG Protocol inventory

Structure Scope 1, 2 and 3 accounting around recognized corporate and value-chain guidance.

Fashion-specific Scope 3

Use product LCAs to calculate purchased goods with product and supplier detail.

Primary data visible

Track where calculations use factual evidence and where gaps still need review.

Controlled methodology

Use validated datasets and approved custom emission factors with a clear audit trail.

Trusted by fashion and retail teams

Calida
Deichmann
PDS Limited
Voice
Arvind
MAS Holdings
Asmara
Giltex
Sealand
Enviu
Virgio
Mira

Build the inventory from connected evidence.

Bring activity data, supplier records and product footprints into one ledger. Carbon Trail maps each record to the appropriate GHG Protocol scope and accounting category while preserving its source and review status.

  • Connect existing systems and spreadsheet workflows
  • Keep source files and calculation evidence together
  • Refresh the inventory as primary data improves
Connected data ledgerDemonstration workflow
4 sources ready
ERP and financeActivity and purchasing data
Connected
Supplier evidenceBills, meters and facility data
Validated
Product LCAsMaterials, processes and geography
Calculated
Business systemsTravel, logistics and operations
Mapped
Source retainedCompany inventory updated

Make Scope 3 specific to what you sell.

Calculate the Scope 3 Purchased goods and services emissions with Carbon Trail product footprints. Each footprint accounts for the product’s specific materials, fabric formation and supplier energy data at process level, then combines that result with purchase-order quantity.

Scope 3Purchased goods lead the footprintProduct and supplier detail connected
86.7% of company footprint
Share of Scope 3100% total
Purchased goods and services63%
Upstream transportation and distribution9%
Use of sold products8%
End-of-life treatment of sold products6%
Downstream transportation and distribution5%
Capital goods3%
Business travel2%
Employee commuting2%
Fuel- and energy-related activities2%

Build dashboards around the questions your team tracks.

Carbon Trail dashboards are custom. Choose the metrics, filters and chart types that matter to each team, subsidiary or reporting view.

  • Add totals, intensity, primary-data coverage and other metrics
  • Filter by subsidiary, facility, scope and reporting period
  • Switch between bar, line, breakdown and ranking views
Custom overview dashboardDemonstration data
Group · 2024
Total emissions291,958.98tCO₂e
Primary data74%Coverage
Highest emitterPurchased goodsScope 3
Emissions by sourcetCO₂e
Purchased goods and services267,210
Upstream transport15,410
Retail estate5,860
Business travel3,478
Scope 1Scope 2Scope 3

Demonstration overview: Scope 3 is the largest share of emissions, led by purchased goods and services, followed by upstream transport, retail estate and business travel.

Use one corporate carbon footprint across disclosure requirements and requests.

The CCF module keeps emissions totals, organizational boundaries, calculation records and supporting evidence together. Reuse that governed inventory when preparing statutory reporting and questionnaires for CSRD and ESRS E1, California SB 253 and CDP.

Disclosure mappingCorporate carbon footprint
Inventory connected
Carbon Trail CCFGHG Protocol-aligned inventory
Scope 1Scope 2Scope 3Evidence
GHG ProtocolCorporate inventory structure
Scopes 1, 2 and 3
CSRD · ESRS E1Climate disclosure inputs
Gross GHG emissions
California SB 253Corporate emissions reporting
Scope 1, 2 and 3 records
CDPCorporate climate questionnaire
Metrics and evidence
Governed emissions dataReady to prepare disclosure inputs

Find gaps across every facility and inventory month.

Carbon Trail checks whether each facility, vehicle and other activity source has submitted complete data for the selected inventory year. Missing months stay visible until the team accepts a suggested proxy or updates the record.

  • Detect missing months by facility, vehicle and activity
  • Suggest seasonal proxies using the same months from a previous year
  • Use averages of available months when that is more appropriate
Inventory gap analysisInventory year 2024 · Demonstration records
3 gaps found
Monthly activity-data coverage92% complete
Scroll to see all columns
Facility or assetInventory gapStatus
Porto manufacturing facilityElectricity · November and December
2 months missingProxy suggested
European delivery fleetVehicle fuel · April
1 month missingReview
Berlin retail estateElectricity · January to December
No gapsComplete
Milan distribution centreNatural gas · January
1 month missingUpdate data
Suggested proxy · Porto facility electricityUse November and December 2023 actuals, adjusted by the 2024 monthly average.

This preserves the facility’s seasonal consumption pattern while the missing bills are collected.

Accounts for seasonalityUses facility history
Accept proxyUpdate electricity data

Use the right emission factor for every activity.

Apply supplier-specific and recognized factors while retaining the factor source, version and activity data needed for a transparent GHG Protocol calculation record.

Scroll to see all columns
Accounting activityEmission-factor sourceApplied toControl
Supplier electricitySupplier-specific electricity factorMetered kWhPrimary
Purchase orders and salesCarbon Trail Product LCA · PEFCR alignedPCF × quantityApproved
Business travelDEFRA emission factorsPassenger km · classCurrent
LogisticsGLEC Framework factorsTonne-km · modeCurrent
GHG Protocol calculation recordFactor source, version and activity data retained
Audit trail ready

Give every subsidiary the right view and the right access.

Manage carbon data across subsidiaries while keeping a consolidated group inventory. Role-based access ensures that each user works only with the business units and records relevant to them.

  • Separate subsidiary workspaces within one group account
  • Assign administrators, contributors, reviewers and viewers
  • Consolidate approved data into the group dashboard
Organisation and access
3 subsidiaries active
OrganisationData boundary
Meridian Apparel GroupConsolidated group inventory
Owner
NorthlineBrand subsidiary
Ready
Common ThreadBrand subsidiary
Ready
Aster ActiveBrand subsidiary
Review
User accessRole · workspace
SL
Sustainability leadAdministrator · Group
All data
BM
Brand sustainability managerContributor · Northline
Assigned
AR
Assurance reviewerViewer · Consolidated reports
Read only
Access controls appliedGroup view stays consolidated
Spain flag

The same product workflow, adapted for Spain.

Keep one governed source of product and emissions data, then apply the national and European market context your team needs. Requirements can change without fragmenting the calculation or evidence beneath them.

Spain market viewNational + European Union scope
Spain flag
Shared product workflowCarbon accountingProduct · supplier · evidence
MeasureConsistent source data
InterpretLocal applicability
PrepareMarket-ready output
Spain flagSpain + European Union

Textile laws and regulations in Spain

Track current fashion and retail regulation updates across Spain and understand what they may mean for your brand.

Carbon accounting questions for Spain

Common questions from fashion and retail teams evaluating carbon accounting in Spain.

Request a Demo
What is carbon accounting system?

Carbon accounting is a systematic process of measuring, tracking, and reporting an organization's greenhouse gas (GHG) emissions. Carbon accounting systems typically categorize emissions into three scopes (Scope 1, Scope 2 and Scope 3).

Who invented carbon accounting?

The World Resources Institute (WRI) and World Business Council for Sustainable Development (WBCSD) started to develop a protocol for carbon accounting in 1998 and published the first version of Greenhouse Gas (GHG) Protocol in September 2001.

What is the most efficient carbon management tool in Spain?

Carbon Trail is the most accurate and comprehensive carbon management software in Spain that helps fashion brands and retailers automate corporate carbon accounting powered by product lifecycle assessment (LCA) and primary supply chain data at the enterprise scale.

What is the difference between GHG accounting and carbon accounting?

"carbon accounting" is considered a subset of "GHG accounting” as carbon accounting specifically focuses on measuring carbon dioxide emissions, while GHG accounting covers all greenhouse gases, including carbon dioxide.

How much does carbon accounting cost?

The cost of carbon accounting can vary depending on several factors, including the size of the company, the scope of the accounting, and the accounting method used. A consultant in Spain can cost anywhere from €20K to €200K annually, while the software platform can be more affordable. For more details, you can refer to our pricing section and compare different plans.