Turn messy retail data into decisions that reduce impact.

Carbon Trail AI transforms PDFs, spreadsheets, images and incomplete product records into structured sustainability data—then helps your teams find hotspots and decide what to change.

Request a demo

Built for sustainability and sourcing leaders in fashion and retail.

Carbon Trail AI

Help me analyze this product footprint and show me what to reduce first.

Supplier bills.pdf Product BOM.xlsx Material label.png
IngestNormalizeAnalyzeRecommend
Supplier taxonomyOrganic CottonCotton – OrganicCarbon Trail taxonomy

Footprint analysis ready

Manufacturing is the largest contributor, with fabric production driving most of the product’s climate impact.

  • Compare spinning and weaving processes across factories.
  • Review lower-impact fibre options and the remaining data gaps.

Start with the data you already have.

Supplier electricity bills, product BOMs, material certificates and spreadsheets rarely arrive in one clean format. Carbon Trail AI helps prepare those inputs for the platform while preserving the source context your team needs.

Inputs
PDFs, Excel files, images and operational records
Output
Structured import files ready for upload
Context
Source documents, translated text and mapped fields
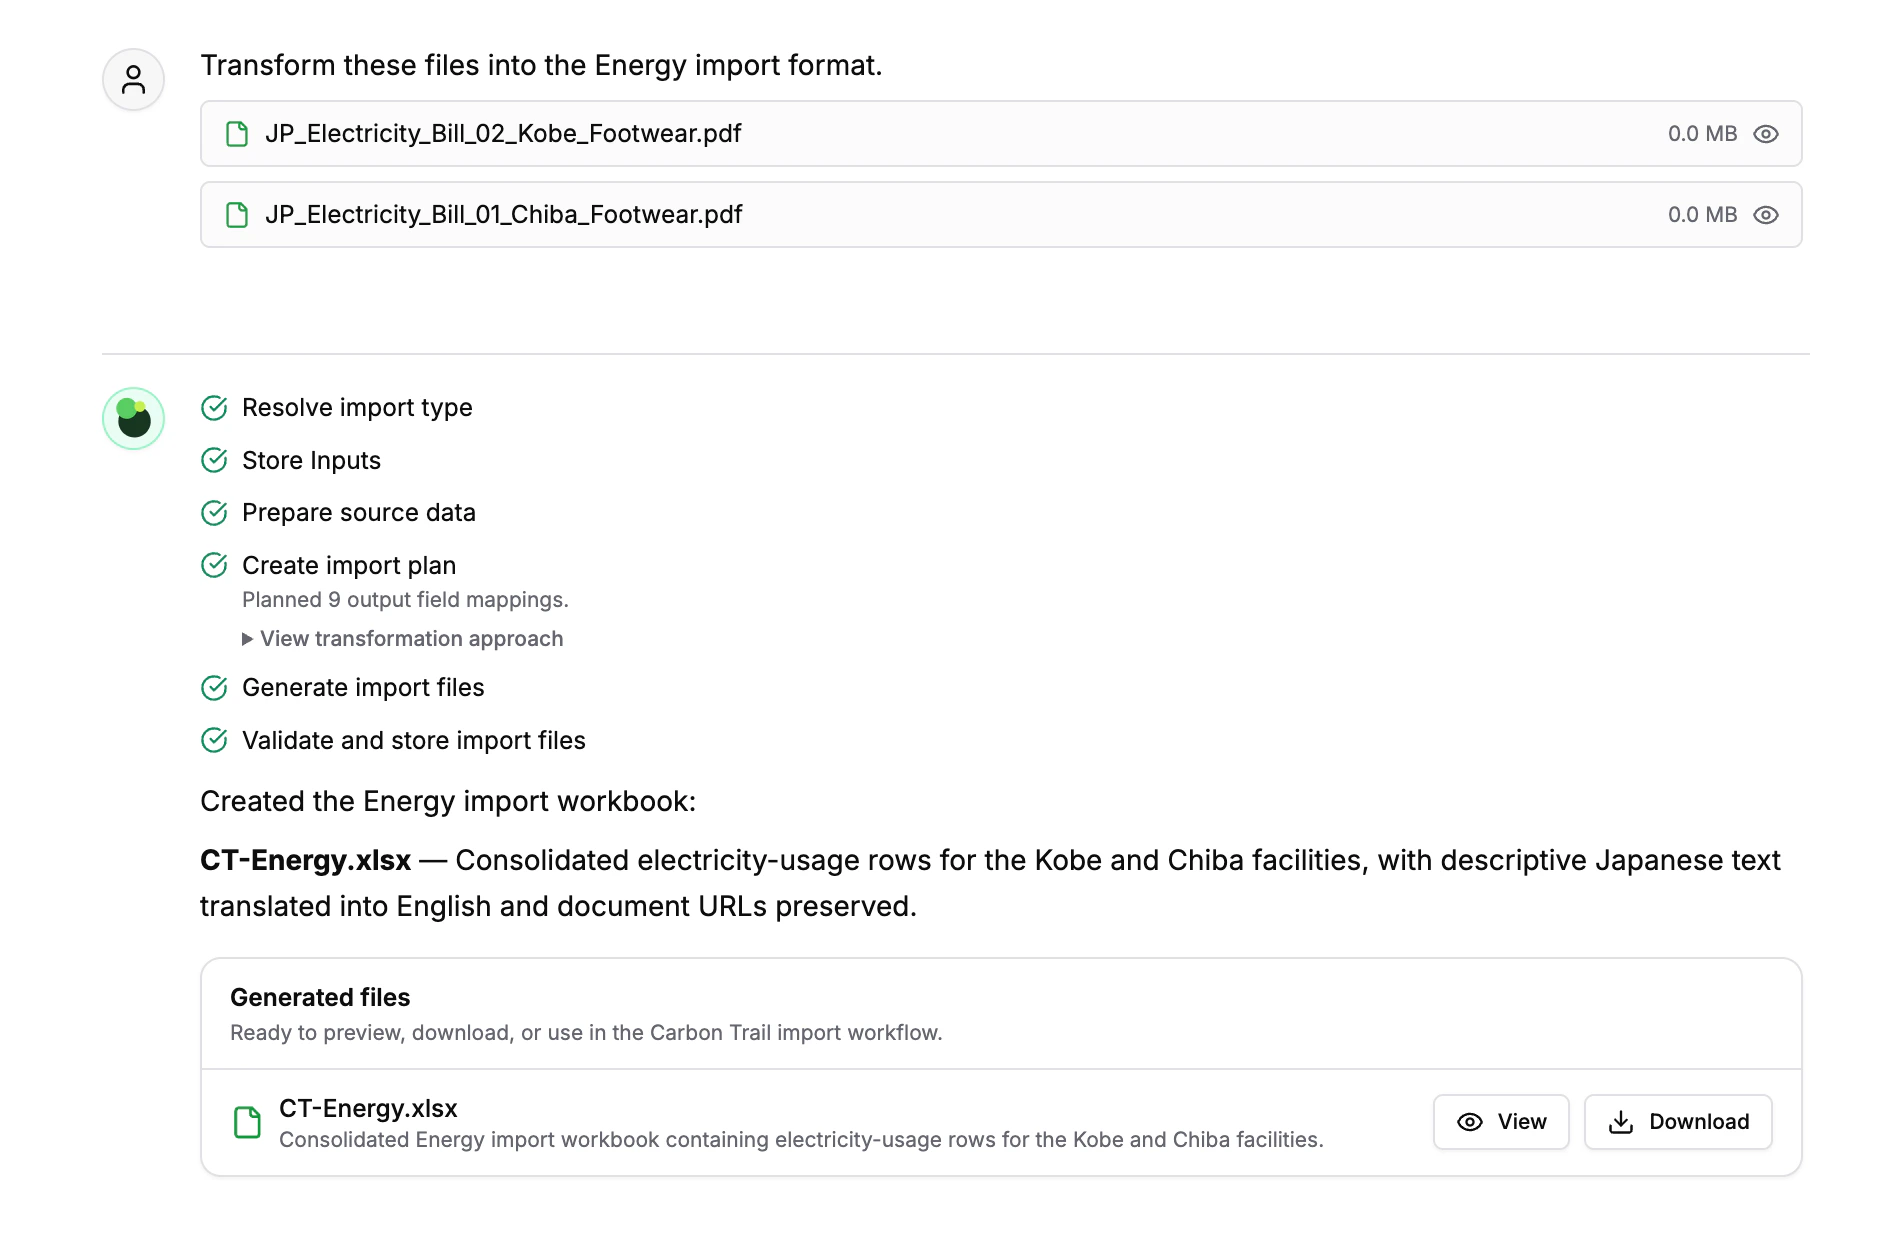
Import Agent transforming two supplier electricity bills into a consolidated Carbon Trail energy workbook
From supplier documents to a structured import workbook.

Make disparate retail data usable together.

Map customer, supplier, PLM and ERP terminology into Carbon Trail’s fashion-specific taxonomy. When product records are incomplete, the platform can help identify and complete gaps such as missing fabric amounts while keeping the work reviewable.

Fabric amountMissing in source file
Carbon Trail AISuggested value ready for review
Field completion

See what drives impact—not just the total.

Move from a calculated footprint to the life-cycle stages, materials and processes that deserve attention first. Carbon Trail AI helps surface hotspots, data-quality gaps and the questions your team should investigate next.

Product-level analysis that keeps hotspots, drivers and data gaps connected.

Compare factory processes and find the reason behind the difference.

Look beyond a top-line result to compare the same processing route across facilities. Carbon Trail AI helps isolate whether the difference comes from energy use, energy source or the local electricity and heat mix.

Process comparison3 facilities · Same dyeing process · 1 kg output

Impact categoryClimate change

Continuous dyeing

Turkey facility

Turkey

Facility

2.37kg CO₂e

Climate changeLowest impact
Renewable energy
17.97%
Energy intensity
7.37 MJ/kg
Water intensity
118.40 L/kg
Continuous dyeing

India facility

India

Facility

2.96kg CO₂e

Climate changeSecond lowest
Renewable energy
7.50%
Energy intensity
13.22 MJ/kg
Water intensity
144.30 L/kg
Continuous dyeing

Bangladesh facility

Bangladesh

Facility

3.17kg CO₂e

Climate changeHighest impact
Renewable energy
0.00%
Energy intensity
6.49 MJ/kg
Water intensity
167.80 L/kg

Carbon Trail AI analysis

Compared processes

Analysis ready

All three facilities use the same continuous dyeing process, but both climate impact and water intensity vary. The differences point to energy amount, energy source, the local electricity and heat mix, and the volume of water used per kilogram.

What explains the difference

TurkeyLowest climate impact and water intensity, using 118.40 L/kg alongside the highest renewable-energy share.

IndiaUses 25.90 L/kg more water than Turkey and has the highest energy intensity in the comparison.

BangladeshHighest water intensity at 167.80 L/kg—49.40 L/kg above Turkey—with no renewable-energy share reported.

Climate impact per 1 kg dyed output
  1. Turkey
    2.37
  2. India
    2.96
  3. Bangladesh
    3.17

kg CO₂e

Water intensity per 1 kg dyed output
  1. Turkey
    118.40
  2. India
    144.30
  3. Bangladesh
    167.80

L/kg

Projected scenario results show the environmental and cost effect of each proposed sourcing decision.

Build a reduction plan sourcing can act on.

Test concrete options such as substituting recycled cotton, installing renewable energy at spinning and weaving facilities, or changing a freight route. Sustainability and sourcing teams can compare projected CO₂e reductions with the cost effect before committing.

ProductMaterials and processesFactoryOperational driversCompanyPortfolio hotspotsDecisionImpact and cost trade-offs

AI that leaves an evidence trail.

Automation should make the work easier to inspect, not harder to explain.

  1. SourceKeep original inputs connected to the resulting work.
  2. MappingReview how customer and supplier terms were normalized.
  3. GapsSee missing data and proposed completions before relying on them.
  4. OutputInspect generated files and analysis before using them downstream.

Bring your messy data. Leave with a clearer path forward.

See how Carbon Trail AI can work with your product, supplier and company data.

Request a demo